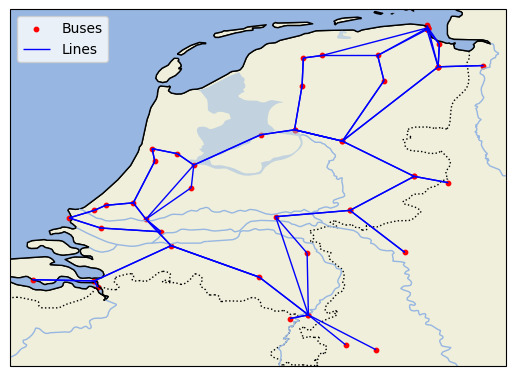
This is a model of the Dutch tranmission grid, generated by me, based on the public dataset published by TenneT [1]. The dataset consists of an excell to pdf converted file. Due to the conversion certain cell are cut of, but all numeric values are visible.
To build this model, the first step is to preproces the Tennet data, which can be found HERE (include link). The data import tool from excel is used to import date from the PDF. THen the data is manully cleaned. Most coordinates had missed the "." symbol. some columns needed to be fixed. The tables are joined together. The excel file is exported as a CSV file, for further processing in Python.
The next step is to proces the data in Python. The csv file contains all the lines, with a unique name. however the busses are all at least twice in the dataset.